Harnessing Advanced Analytics & Visualizations for Smarter Decision Making in The Digital Age

In today’s data-driven world, where information is generated at an unprecedented rate, organizations are facing the daunting challenge of transforming this vast sea of data into actionable insights. Traditional decision-making processes no longer suffice in the face of complexity and volatility. This is where the synergy of advanced analytics and visualizations comes into play, offering a powerful toolset for making smarter decisions in the digital age.
The Evolution of Decision Making
Gone are the days when decisions were based solely on intuition or limited information. The digital age has ushered in an era where data is the new currency. Organizations now have access to a multitude of data sources, ranging from customer interactions and market trends to internal operations and supply chain dynamics. While this influx of data can be overwhelming, it presents a golden opportunity for those who can harness its potential.
Advanced Analytics: Unearthing Insights from Data
Advanced analytics involves the use of sophisticated techniques to extract valuable insights from complex data sets. Machine learning, artificial intelligence, predictive modeling, and data mining are some of the tools under the advanced analytics umbrella. These techniques allow organizations to identify patterns, correlations, and trends that might otherwise go unnoticed. By analyzing historical data, organizations can make informed predictions about future outcomes and trends, enabling proactive decision making.
For instance, in the retail sector, advanced analytics can analyze purchasing behaviors to forecast demand for specific products during certain seasons, enabling optimized inventory management and stocking levels.
Visualizations: Turning Data into Understandable Insights
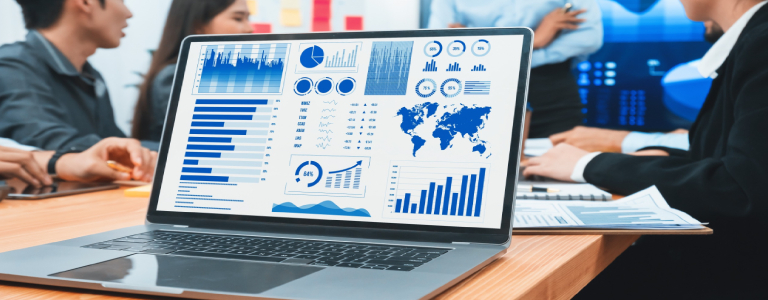
While advanced analytics uncovers insights, visualizations provide the means to communicate these insights effectively. Visual representations of data, such as charts, graphs, and interactive dashboards, transform complex information into easily understandable formats. This is crucial for decision makers who may not have a background in data analysis.
Imagine a complex financial report that is transformed into a series of interactive visualizations, allowing executives to explore revenue trends, cost structures, and profitability drivers at a glance. Visualizations make it easier for decision makers to identify key trends, outliers, and correlations, enabling them to make faster and more accurate decisions.
The Power of Integration
The true magic happens when advanced analytics and visualizations are integrated seamlessly. Insights from advanced analytics can be visualized in real-time dashboards, providing decision makers with dynamic, up-to-date information. This integration facilitates a more holistic view of the organization’s performance and allows decision makers to spot emerging opportunities and risks.
Consider a scenario in healthcare where patient data is analyzed using machine learning algorithms to predict disease outbreaks. These predictions are then visualized on a map, enabling healthcare providers to allocate resources strategically and respond proactively to potential outbreaks.
Benefits of the Synergy
The synergy between advanced analytics and visualizations offers a plethora of benefits for organizations in the digital age:
- Data-Driven Decision Making: Organizations can move away from gut feelings and assumptions, making decisions that are backed by concrete data and insights.
- Faster Decision Making: Visualizations make it quicker to grasp complex information, reducing the time required to make informed decisions
- Proactive Responses: Predictive analytics enable organizations to anticipate future trends and take proactive measures, preventing issues before they escalate.
- Strategic Insights: By identifying patterns and trends, organizations can gain a deeper understanding of their market, customers, and operations, driving strategic planning.
- Enhanced Collaboration: Visualizations provide a common language for teams, facilitating better communication and collaboration across departments.
Conclusion
In the digital age, where the velocity and volume of data are growing exponentially, the marriage of advanced analytics and visualizations is not just an option but a necessity. Organizations that can effectively leverage these tools stand to gain a significant competitive advantage.
The insights derived from advanced analytics, combined with the clarity and accessibility of visualizations, empower decision makers to navigate complexity, capitalize on opportunities, and steer their organizations towards success in an increasingly data-rich landscape. As we forge ahead into a future defined by data, the partnership between analytics and visualizations will continue to reshape how we make decisions and shape the trajectory of businesses and industries alike.


